Next Generation Forecasting
Setting the gold standard in forecasting, guaranteed by Data Quality SLA
Key Points
- Our platform offers forecasting up to 4 years ahead of the curve
- We guarantee forecast accuracy with a Data Quality SLA and calibration to retail sales data
- Patented engine isolates regional, category-specific Trendsetters and measures spread to Mainstreamers
- Key metrics like Potential Growth and Lead-Lag Scores power our regression model for precise predictions
Rethinking Forecasting
Consider the last trend forecast you read: did you get something tangible and trustworthy — a verifiable forecast with real metrics from a structured system with a documented methodology? Or was it just marketing hype, distributed for free?
In today's data-driven world, forecasting has become a staple of fascination in many industries. However, amid the buzz and promises, there's an unsettling problem: most forecasting clearly lacks methodology and accountability.
We're here to change that. The genesis of every trend resides in a group of early adopters, known as the Trendsetters, who champion its acceptance ahead of the masses. Their enthusiasm gradually propels wider acceptance among Mainstreamers, which drives corresponding revenue for companies offering related products or services.
Our platform identifies Trendsetters and models how their economic activity transfers into Mainstream sales. To validate accuracy, we offer a Data Quality SLA with auditing.
What are Trendsetters (vs Mainstreamers)?
Trendsetters are defined as accounts which, in the past five years, have first activated at least 20% of our pre-defined Key Trends a minimum of three years before each Trend's Peak Adoption.
We identify Trendsetters by analyzing Key Trends that have peaked in recent years across all accounts in the segment. For each Key Trend, we measure historic adoption for each account posting about the Trend to determine which accounts activated earliest. When aggregated, these accounts have consistently been "early adopters".
Mainstreamers are the accounts which are not Trendsetters. By default, Mainstreamer adoption is uncalibrated, or not directly correlated with another signal like retail sales. A calibration process can align Mainstreamers to retail sales data.
Forecasting Methodology
Our forecasting is based on accountability and has both short-term and long-term modes. We model using an energy-based model of trend propagation. Trendsetters serve as the initial catalyst for any trend. As adoption grows within this group, it mirrors the accumulation of potential energy within a system. The more Trendsetters adopt, the greater the potential for expansion.
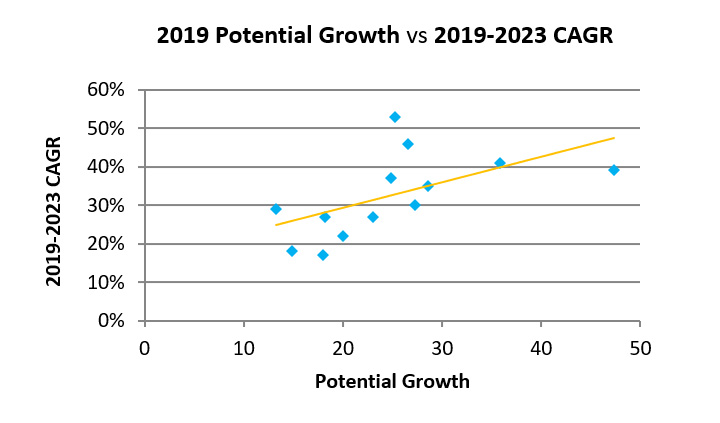
Growth Potential measures the difference of user adoption between Trendsetters and Mainstreamers:
Trend Growth Potential = Trendsetter Adoption / Mainstreamer Adoption
A trend with higher adoption among Trendsetters harbors more potential energy to catalyze sales among Mainstreamers. The Potential Growth score is a key starting indicator to quickly identify potential trends.
The chart above shows a collection of ingredients and their Potential Growth compared to CAGR. This metric is a good starting point. Every forecast also includes two more specialized metrics:
- Transfer Rate: How quickly adoption moves from Trendsetters to Mainstreamers
- Lead-Lag Scores: Assigned to every account based on how many years in advance or delay they tend to align with trends
Another key metric is the Revenue Differential - the ratio of Mainstreamer Adoption to Revenue. This is required for Long Term Forecasting and requires a Calibrated Mainstreamer segment.
We combine these metrics into a finely tuned regression model that precisely predicts when trends will peak and the extent of their growth.
Market Segment Calibration
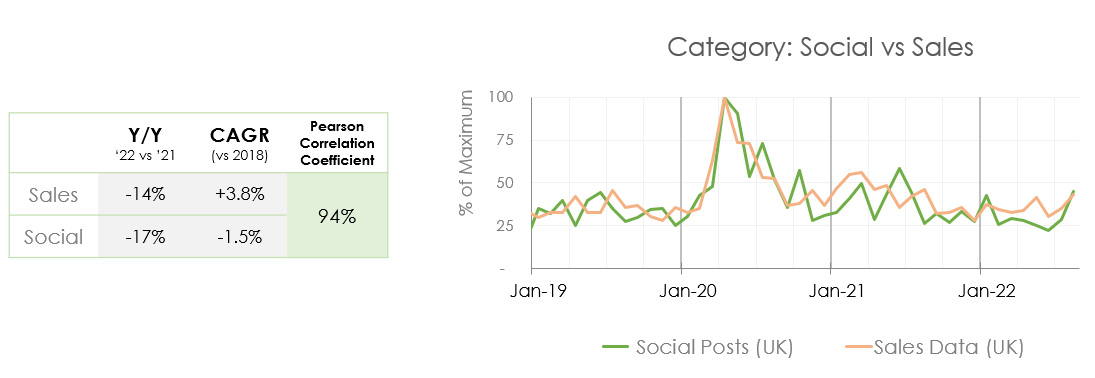
Social signals are generally out of sync with sales data. Our calibration process takes regional sales data and aligns the social Share of Posts for the Mainstreamer Segment to the sales data so the two signals are sufficiently correlated.
A 94% Pearson Correlation Coefficient is high, showing that the sales data can be used as an independent basis for forecast accuracy. This also helps us isolate Calibrated Trendsetters for a given Region + Category, which are the most valuable group for forecasting.
Short vs Long Term Forecasting
Uncalibrated Mainstreamers support a 1 year forecast window. Calibrated Mainstreamers can support forecasting up to 3-4 years in advance, depending on the region and category.
Data Quality SLA for Forecasting
Our commitment to delivering accurate and reliable forecasts is built on stringent data quality standards. This Data Quality Service Level Agreement (SLA) outlines our promise to provide top-tier data integrity.
- Forecast Accuracy: We guarantee the accuracy of specific forecast metrics, ensuring your forecasts align closely with actual outcomes.
- Auditing Interface: We offer an auditing interface where we collaboratively agree on an auditor and specific metrics to be validated.
- Completeness and Reliability: We ensure all necessary data points are captured and maintained with continuous availability.
- Transparency: We provide clear documentation and reporting on data quality metrics.
With our SLA, we empower forecasting with high-quality data, fostering informed decision-making and strategic planning.